Thanks to my friend Hannah Nichols for helping with my thoughts around this. Any mistakes or issues are definitely my own though!
Why does Net Promoter Score (NPS) matter?
NPS is one of many customer-focused metrics that reveals perceived experience by customers and works best when assessing customer loyalty. While this metric has its own fair share of promoters and detractors, it has come to dominate the world of customer experience (CX).
NPS can be categorised into three different types:
- Strategic NPS, measured periodically (often annually) compares loyalty within an industry and amongst competitors, and is often conducted by a third party.
- Relationship NPS, measured on a regular basis, helps to assess loyalty within different customer segments and can help identify customer segments in need of attention.
- Transactional NPS, targeted after customers have triggered an important event or completed a key action, allows measurement of loyalty linked to specific interactions within a product.
Transactional NPS is the most actionable for a product team, especially when linking it to key points along the customer journey. Relationship NPS are the most actionable for customer teams, as it can help them prioritise the customers they reach out to.
So what is the problem and how will we solve it?
Companies generally want to record NPS to better measure their CX impact. Systematic measurement helps improve CX by pinpointing:
- dissatisfied customers with greater churn risk;
- succeeding customers for learning opportunities;
- under-performing product areas that generate dissatisfaction; and
- ‘delighter’ product areas which can also be learnt from.
There are three key actions that will help you use NPS to improve CX:
- Develop a layered customer journey, which should cover customer interactions with your products and team (e.g. sales and support)
- Map NPS to each point on the journey; and
- Collect more NPS data to get meaningful results, without fatiguing customers.
Developing a layered customer journey
Context
I’m not an expert in developing a customer journey map – just in applying data to those maps to make better decisions. Each company will be very different so use the customer journey map below as example to apply to your own context.
The core concept involves a multilayered journey that increases in resolution the deeper you go. The deepest layers also cascade back up to give the overall picture of your company’s customer loyalty.
You start at Level 1 – which are the broad stages a customer will go through to begin using your product. Level 2 would explore each of these stages, with even lower layers able to explore different products, features, key actions, and further minutiae. Lower layers can also be segmented by customer type, geography or anything else.
Sample size is fundamental
However, there is one rule of going deeper. You are always limited by the sample size you collect. If you only have 100 survey responses, you can’t go deeper than Level 1. If you have way more, say 10,000 responses, you could go down to Level 3 or 4 depending on how you construct your journey map.
I may do another article on NPS statistics, but for now I’ll just say that 30 responses per section would be an absolute minimum (this would give you roughly a ± 10% error rate, which is still useful to see major issues) but ideally you could get up to 200 or so per section (which is closer to a ± 5% error rate). Either is OK – as long as you understand the limitations of the sample size you are working with.
Level 1
The figure below shows that a customer goes through the stages of first being exposed to your product, to going through a purchase process, to getting value from the product over time. This is a bit SaaS-centric, but the same principles apply for any product and business model.
If you had 300 total NPS responses in a month, with 100 responses in each area, you may already start to get some insights. Let’s say Exposure and Service was in the 30s for NPS, but Purchase was a 10.
Given the sample size, this would be statistically significant enough to support a decision. A recommendation could be made that to improve CX, you should focus on the Purchase component of the journey.  Level 1 Example. A customer is first exposed to your product (Exposure), then goes through a purchase process (Purchase), and then gets value from your product over time (Service). This should be high-level but tailored to your organisation.
Level 2 and beyond
It gets far more interesting when you dig down into the journey. This can help you prioritise where exactly to focus in Purchase. Breaking Purchase into substages, you might have Browsing the Website, Adding items to a ‘Cart’, and Checkout.
Analysing your NPS data could show that NPS was -20 for Adding to ‘Cart’ with NPS comments saying that an annoying bug was dramatically reducing the UX when trying to purchase products.
This gives extreme clarity on what the team should be focusing on improving, with a clear success measure defined – if the bug is fixed, you’d hypothesise that the NPS would increase closer to that of the Browsing Website and Checkout substages. 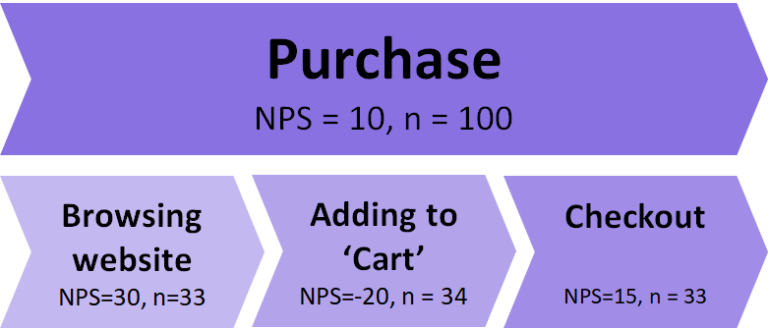
Further layers may involve mapping individual features or Key Actions within products, segmentation by gender, age or geography, or simply reducing the reporting cadence from monthly to weekly.
CX resolution enhances with depth which provides better customer insights, allowing further improvements to the product. However, data is the raw fuel needed to support this interrogation (otherwise the margin of error gets too large) so data will always be the limiting factor for this type of CX exploration.
Next Steps
Knowing all this, what do you do now? Well it depends on your starting point.
Option A: I have minimal NPS responses (less than 100 responses per month)
- Get. More. Data. It might be writing better copy or sending more surveys out but you can’t do anything without the data.
- Once you have solved step 1 follow the steps in Option B. You can start there once you have at least 100 responses (but can’t go deeper until you have more data).
Option B: I have plenty of NPS data (at least a few hundred responses per month)
- Create a Level 1 and Level 2 Customer Journey and map NPS to each point. See if there are any outliers.
- Once you have identified where the gaps are in customer experience, engage the relevant teams in the business to make them aware and work with them on developing solutions to get that number up.
- As the business sees how this can be used for prioritisation and increasing customer value, you can get buy in and business engagement, and invest more in collecting more data because you’ve demonstrated competency in using it.
- Identify levers you can pull to collect more data.
- As you collect more data, you can dive deeper into the customer journey and further break down stages, segment by customer type, and explore the customer in any way relevant to you.
Implementing this should see your business making more informed decisions with NPS, using NPS data to prioritise customer and product attention, which should see your NPS increase over time.