With COVID-19 and lockdowns I’ve been enjoying getting more into Settlers of Catan – a board game created over 20 years ago and still highly popular today.
When playing, I can’t help but think of optimal strategy and I’ve been extremely interested in how Catan helps guide you towards the best strategy through its game design.
Why are two dice great in board games?
With only one dice, you have a uniform distribution of random outputs. Your strategy here is simple – any decisions made have an equal chance (1 in 6 or 16.67% chance) of happening.
This can be why a game like snap isn’t so much strategic as it is a test of physicality (reflexes) – cards emerging have a uniform distribution (although I suppose there is a conditional probability element to consider if you can think that fast).
The probability spread of a single dice roll is shown below:
import matplotlib.pyplot  as plt

plt.bar(range(1,7), [1/6]*6)
plt.xlabel('NUMBER')
plt.ylabel('PROBABILITY')
plt.title('Single dice rolls follow a uniform distribution')
plt.show()
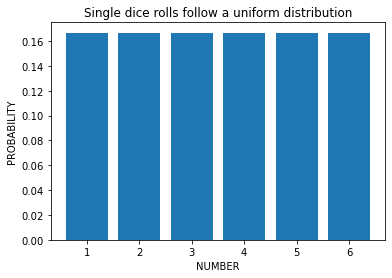
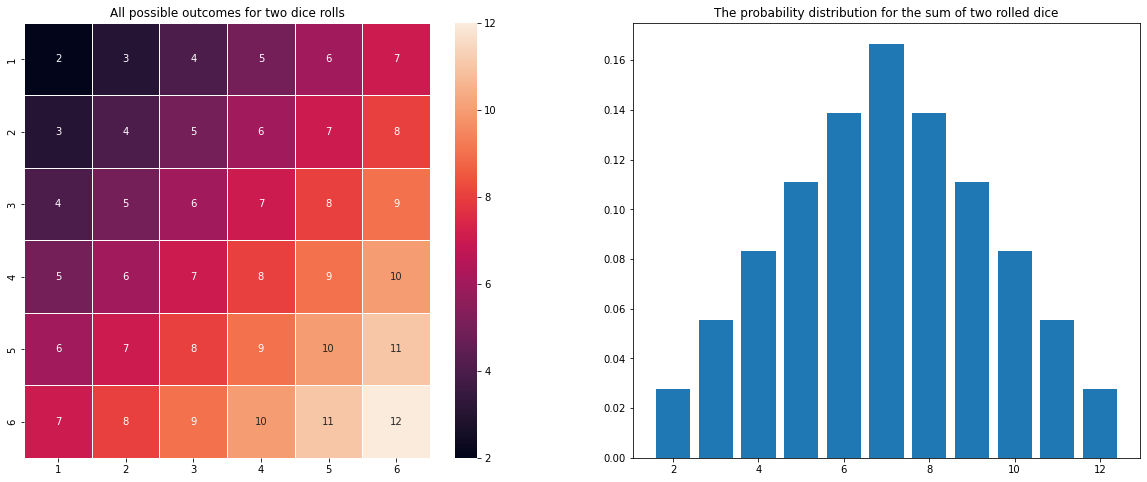
Catan doesn’t leave you to this drab uniformity. It instead introduces a second die, which almost magically transforms the distribution into one that more closely represents a normal distribution.
With this you can actually think a bit more deeply about how likely something is happening – you can strategise towards numbers with higher chances of rolling and steer clear of low-probability rolls like 2 and 12.
import numpy as np
import seaborn as sns

outcomes = np.zeros((6,6), dtype=np.int32)

for i in range(1,7):
    for j in range(1,7):
        outcomes[i-1][j-1] = i+j

unique, counts = np.unique(outcomes.flatten(), return_counts=True)
probs = counts/36

fig, axs = plt.subplots(1,2, figsize=(20,8))

ax0 = sns.heatmap(outcomes, linewidth=0.5, annot=True, xticklabels=range(1,7), yticklabels=range(1,7), ax=axs[0])
ax0.set_title('All possible outcomes for two dice rolls')

axs[1].bar(unique, probs)
axs[1].set_title('The probability distribution for the sum of two rolled dice')

plt.show()
OK cool – but why specifically call out Catan?
So we’ve talked a bit about the statistics. Now into Catan’s specific design.
Catan has dots on its numbers. 2 and 12 have 1 dot, 3 and 11 have 2 dots and so on with 6 and 8 having 5 dots. (7 doesn’t get a circle or dots because something special happens when 7’s are rolled).
Now – the beauty is that these dots correspond exactly to the frequency they’d be rolled in 36 rolls. You can look at the heatmap and count the numbers and you’ll see it’s an exact match.
This means you don’t have to be a statistician to calculate where it is most optimal to put your settlements – you just add up the dots and the highest group of dots will always be the most likely to be landed on!
You still have to strategise on resources you want, placement towards the ports, etc but this helps reduce the gap between non-math people looking to have fun and people like me who would be calculating the probabilities in my head to optimise decision-making, ultimately making for a closer game.
This is a simple observation but such a simple addition I think greatly improves the accessibility of the game.
It’s a helpful reminder that accessibility isn’t always about disabilities – but simply trying to ensure that a product or service can be used by as many people as possible. For a board game like Catan – the ultimate goal is widespread enjoyment so there is no need to have a mathematical barrier which limits that fun for some and not others.